
There are three types of data:
+ Cross-Section: the data is collected by observing multiple subject at the same time (e.g. GDP of Southest Asia countries in 2010).
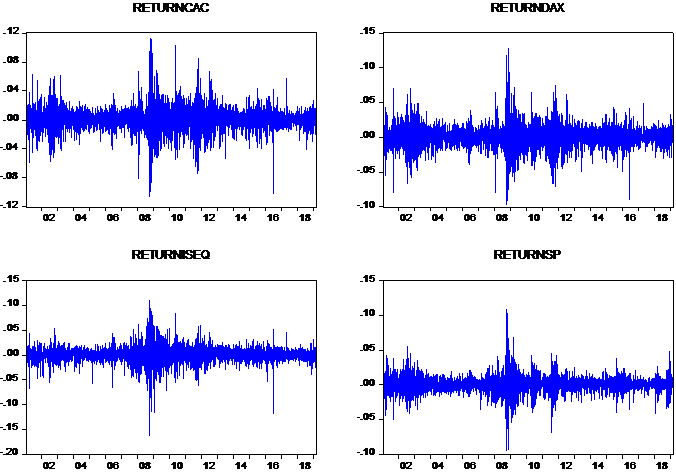
+Time Series data: is series of data points in the order of time (e.g. US stock index for 5 years, UK GDP in 20 years) Normally Time series is used for Macroeconomics, however, in financial industry time series plays an important role in analyzing data such as stock index.
+ Pooled data: Combination of cross section data and time series data including Panel, longitudinal or micropanel data.
When we process time series, it is important to notice: the stationarity, autocorrelation, Seasonality.
The stationarity: A time series is stationary when it’s statistical properties don’t change over time.
In order to check the stationarity we will use unit root test
Normally, the first difference of the data (I(1)) is stationary.
The Unit root test including many types of test :
Base on the data description, we will choose the suitable type of test to test the stationarity of the timeseries.
E.g. If the data has a break structure, Phillips-Perron is preffered in comparision with ADF test
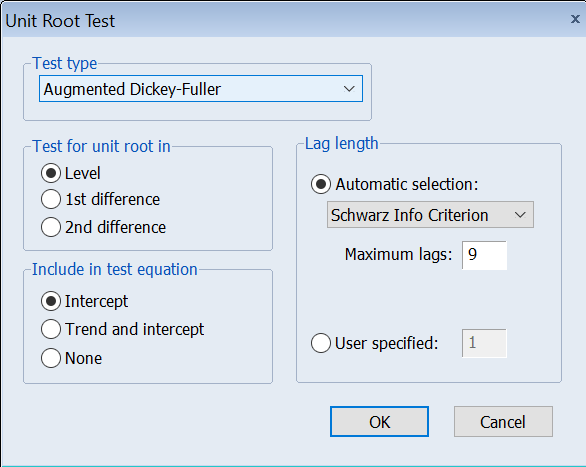
In order to access the unit root test: click in the time series we want to analyze =>View=> Unit root test.
Autocorrelation
Autocorrelation or serial correlation is the similarity between observations as a function of the time lag between them.
We can predict the autocorrelation using correlogram.
Eviews: Click in the data => View => Correlogram…
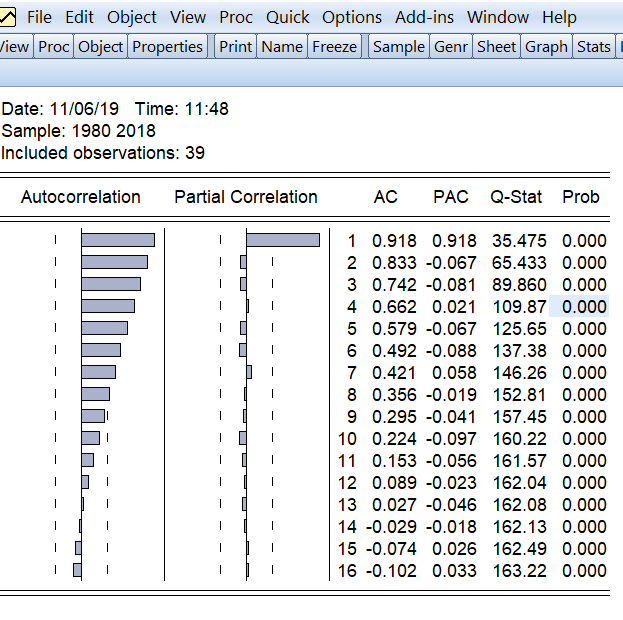
ACF plot in the image above shows that the first value has high autocorrelation since it’s value is the highest.
Seasonality refers to periodic fluctuations (e.g. icecream will be sold more in the summer, and will be sold less in the winter).
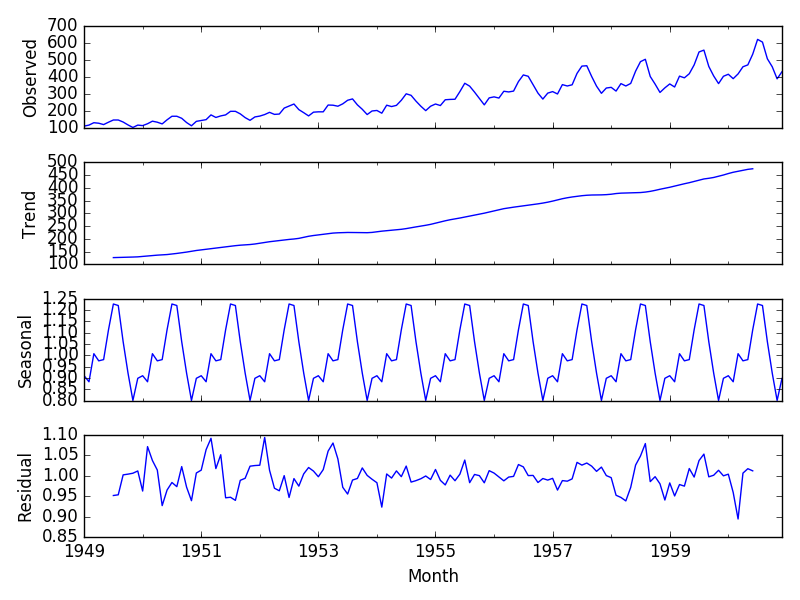
Source: Brownlee, J. (2019). How to Decompose Time Series Data into Trend and Seasonality.
The picture above describe the data has seasonality, residual or trend. It can be seen that the observed data includes seasonality and upward trend.
In order to take a closer look at time series analysis, I will write other topic about cointegration, unit root test, Granger Causality, Johansen process, and what diagnostic test should be taken for VAR/VECM model.
Thank you for reading my blog. I am happy to discuss further about time series.
Reference
- Brownlee, J. (2019). How to Decompose Time Series Data into Trend and Seasonality. [online] Machine Learning Mastery. Available at: https://machinelearningmastery.com/decompose-time-series-data-trend-seasonality/ [Accessed 6 Nov. 2019].
- Peixeiro, M. (2019). Almost Everything You Need to Know About Time Series. [online] Medium. Available at: https://towardsdatascience.com/almost-everything-you-need-to-know-about-time-series-860241bdc578 [Accessed 6 Nov. 2019].
- En.wikipedia.org. (2019). Unit root test. [online] Available at: https://en.wikipedia.org/wiki/Unit_root_test [Accessed 6 Nov. 2019].
